Data & Analytics
With the rise of Big Data, the ability to understand, interpret, and utilize data has become an extremely valuable skill. For individuals looking t...
In this course we are going to show you how to SUPERCHARGE your Power BI skills, and learn to create INTERACTIVE Dashboards and INCREDIBLE reports....
Free
Business
If you want to learn how to perform the basic statistical analyses in the R program, you have come to the right place. Now you don’t have to scour ...
Free
Data Visualization with R – course syllabus 1. Data Visualization in R What is data visualization? Selecting right chart type Importance of d...
Free
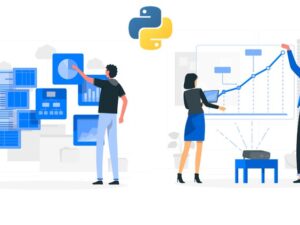
Data Visualization with Python – course syllabus 1. Introduction to Data Visualization What is data visualization Benefits of data visualizat...
Free
Business
Welcome! My name is Ben Gutkovich and I’m the founder of ConsultingCase.Pro and the creator of the QuantMaster™ Ace the Interview Math Online Cours...
Free
Business
SQL is a programming language used to perform tasks on database using SQL you can create update and modify and delete records on a database this co...
Free
Summary Forget the dry, old, textbook approach to learning code. Forget endlessly drilling syntax. This course puts SQL in context and gets you sol...
Business
Want to get into the core of Marketing Analysis! ‘A Marketing Analyst is the need of the hour and can take your career graph up’ All you need is th...
Free
Statistical Analysis and Research using Excel is a blended learning program of theoretical knowledge with its application in Microsoft Excel softwa...
₹99.99

