Microsoft Power BI for Construction Management

- Description
- Curriculum
- FAQ
- Reviews
-
Welcome to the “Power BI Mastery Camp for Civil Engineers” on Udemy, led by Shripad Khaparde—a seasoned Civil Engineer with over 30 years of experience in India and Oman, coupled with an MBA. This comprehensive course is designed to empower civil engineers with the essential skills to leverage Power BI for data analytics in construction projects.
-
With a curriculum meticulously crafted by an industry expert, students will delve into the practical applications of Power BI in the realm of civil engineering. Shripad Khaparde, drawing on his extensive experience, focuses on utilizing Power BI as a transformative tool for project data analytics. This course goes beyond basic proficiency and equips learners to harness Power BI for generating stunning Management Information System (MIS) reports crucial for client decision-making.
-
The content is structured to enhance career growth opportunities for civil engineers and management professionals alike. Students will explore diverse areas such as daily progress reporting, project introduction dashboards, revenue analysis, resource allocation, and the creation of interactive dashboards comparing planned versus actual project metrics.
-
Purchasing this course is an investment in your professional development, guided by an industry veteran. Unlock the power of Power BI to elevate your capabilities, make informed decisions, and produce visually compelling reports that propel your career forward. Enroll now to embark on a transformative journey in civil engineering data analytics with Shripad Khaparde’s “Power BI Mastery Camp.”
-
Get Benefit from Live Sessions for Fast Mastering.
-
1
 Introduction
After completing the Power BI Mastery Camp for Civil Engineers, students will acquire the skills and knowledge to proficiently utilize Power BI for various tasks related to civil engineering projects. Here's a breakdown of what they will be able to do:
Prepare Daily Progress Report in Excel or Google Sheets:
Understand and implement effective data structuring techniques in Excel or Google Sheets for daily progress reporting.
Utilize Power BI to extract and visualize relevant data for creating comprehensive daily progress reports.
Dashboarding Project Introduction:
Design visually appealing and informative dashboards to introduce and provide an overview of civil engineering projects.
Incorporate key project details and milestones in a clear and concise manner using Power BI visualization tools.
Revenue, Daily Labor, Material, and Machinery Reports:
Integrate data sources to generate reports on project revenue, daily labor, material usage, and machinery utilization.
Develop Power BI reports that allow for quick and accurate analysis of financial and operational aspects of the project.
Resource Analysis:
Utilize Power BI to perform in-depth resource analysis, assessing the availability and allocation of resources throughout the project lifecycle.
Visualize resource utilization patterns and identify potential bottlenecks or areas for improvement.
Planned vs Actual Interactive Dashboards:
Create dynamic dashboards that compare planned project activities with actual performance.
Implement interactive features in Power BI dashboards to allow users to explore and analyze deviations from the planned project schedule or budget.
By the end of the Power BI Mastery Camp, students will have gained hands-on experience in using Power BI to transform raw project data into insightful visualizations and reports. They will be well-equipped to navigate and manipulate project data efficiently, enabling them to make informed decisions and communicate project progress effectively to stakeholders.
-
2
Installing Microsoft Power BI
https://www.microsoft.com/en-us/download/details.aspx?id=58494
Visit the Power BI Desktop download page: Go to the above official Power BI Desktop download page on the Microsoft website. You can find it by searching "Power BI Desktop download" on your preferred search engine or by going directly to the Microsoft Power BI website.
Choose the version: On the download page, you might find different versions of Power BI Desktop. Choose the version that matches your system architecture (32-bit or 64-bit). Most modern systems are 64-bit.
Click on the download button: Click on the download button to start the download process.
Accept terms and conditions: Before the download begins, you may need to accept the terms and conditions presented by Microsoft. Read through them and click on the appropriate buttons to proceed.
Install Power BI Desktop: Once the download is complete, locate the downloaded file on your computer and run the installer. Follow the on-screen instructions to install Power BI Desktop.
Launch Power BI Desktop: After the installation is complete, you can launch Power BI Desktop from the Start menu or desktop shortcut.
Keep in mind that Microsoft may have made changes to the download process or updated the software since my last update. Always check the official Microsoft website for the latest information and instructions.
-
3
From Excel workbook to stunning report in Power BI Desktop
Unlock the Power of Microsoft Power BI in Project Management! ?Dive into the world of data analytics with our introductory lecture on Microsoft Power BI, designed to empower you with essential tools for crafting impactful dashboards. Build your first dashboard with our step-by-step tutorial, complemented by Lecture-3 video and an attached tutorial PDF. Don't forget to import the financial sample.xlsx for an immersive hands-on experience!
Assignment Alert: Submit your "Executive Summary – Finance Report" after mastering your first dashboard, setting the stage for converting project daily progress reports into dynamic MIS reports. ?
Ready for the Power BI Mastery Camp for Civil Engineers? Here's a sneak peek at what's coming up:
1️⃣ Daily Progress Report Building: Learn the art of crafting insightful reports by collecting daily entries from various departments—stores, machinery, site operations, and accounts.
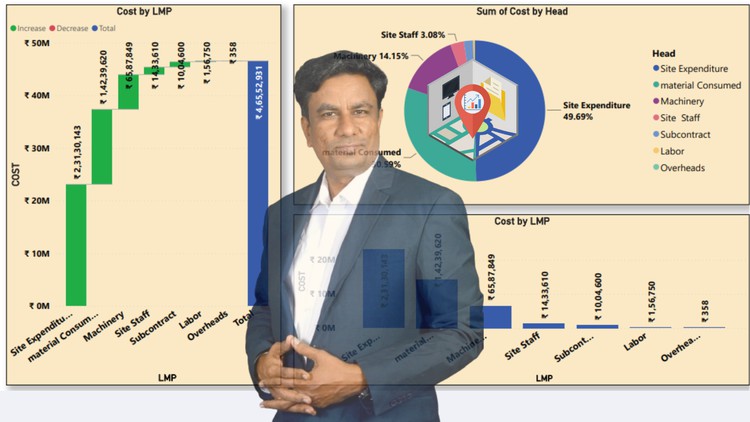
2️⃣ MIS Pages Galore: Delve into the intricacies of MIS dashboard creation, covering everything from project introduction to financial progress. Brace yourself for modules like Revenue, LMP (Labor, Material, and Plant), Resources, Project Profit (daily, monthly, yearly, and cumulative), and more!
Unleash Your Potential: By the end of this Mastery Camp, you'll wield the expertise to construct MIS dashboards offering profound project insights and decision-driven charts for top management. Microsoft Power BI opens the door to unlimited possibilities in project management, allowing seamless integration with MSP or Primavera outputs for truly stunning reports.
Beyond Dashboards: This camp isn't just about building dashboards; it's about mastering the art of understanding Daily Progress Reports (DPR) and leveraging project data for insightful MIS report preparation. Your journey towards informed decision-making in project management begins here! ?dashboards that unveil the true potential of your projects! ?? #PowerBIMastery #ProjectInsights #DataMastery
-
4
 Practice Test Introduction to Power BI and Creating Your First Dashboard