How to Visualize Data with D3

- Description
- Curriculum
- FAQ
- Reviews
Welcome to How to Visualize Data with D3. In this project, join Elisabeth Robson to learn how to incorporate data visualization into your web skills using HTML, JavaScript and the D3 data visualization library. Elisabeth will take you through building a visualization using data downloaded from NASA. You’ll learn how to use D3 to read data into a web page, select and create new elements, and position and style elements to generate a striking color visualization. Along the way you’ll learn from the ground up how to use D3: how data binding works, how to use methods to add attributes and style on D3 elements, and how to use scale functions to process data points as you build the visualization.
At the end of the course you’ll have completed a data visualization of the NASA data, and have some new skills you can apply to your own data too.
-
1
 Introduction
Welcome to How to Visualize Data with D3. In this project, join Elisabeth Robson to learn how to incorporate data visualization into your web skills using HTML, JavaScript and the D3 data visualization library. Elisabeth will take you through building a visualization using data downloaded from NASA. You'll learn how to use D3 to read data into a web page, select and create new elements, and position and style elements to generate a striking color visualization. Along the way you'll learn from the ground up how to use D3: how data binding works, how to use methods to add attributes and style on D3 elements, and how to use scale functions to process data points as you build the visualization.
At the end of the course you'll have completed a data visualization of the NASA data, and have some new skills you can apply to your own data too.
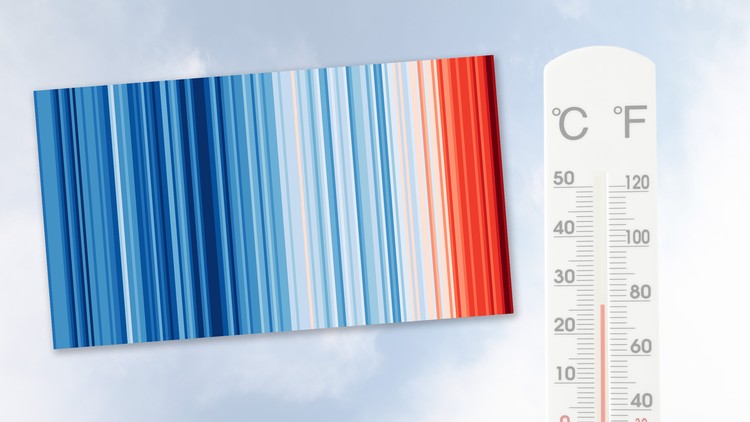
The inspiration for this course is the "Warming Stripes" visualization by climate scientist Ed Hawkins. You can follow him on twitter, or visit his blog to learn more about Ed and his work.
Pre-requisites
To successfully complete this project, we recommend that you have some background in HTML and JavaScript. You don't need to be an expert by any means, but you should have experience building web pages and you should have basic programming skills with JavaScript.
No experience with D3 is required.
Learning Path
Head First HTML and CSS (Chapters 1-6)
Head First JavaScript Programming (Chapters 1-6)
This course: How to Visualize Data with D3
Resources
You can download the completed code from GitHub here: https://github.com/bethrobson/CCC/tree/master/Stripes. We recommend, however, that you follow along starting from scratch to help with the learning process.
-
2
What is a Visualization?
In this lesson, we look at some examples of visualizations, and talk about the key components of the visualization you'll be building.
-
3
Inspect the Data
It's time to take a closer look at the data so we understand the numbers we're working with before we visualize them. In this lesson we step through the data from NASA and explain what it means.
-
4
Get Set Up
In this lesson you'll learn what you need to work on this project, including the data we'll be using to create the visualization.
Resources
Get the source data from NASA (CSV): https://data.giss.nasa.gov/gistemp/tabledata_v3/GLB.Ts.csv
Get the source data from Github: https://github.com/bethrobson/CCC/blob/master/Stripes/GLB.Ts.csv
Get the code files from Github: https://github.com/bethrobson/CCC/tree/master/Stripes
Get the link from D3 (we'll link directly to D3, but you can download the code if you want and link to it on your computer. We'll do this step in the lesson "Build the HTML"): https://d3js.org/
-
5
 Get a Web Server Running
-
6
Build the HTML
In this lesson, you'll create all the HTML we'll need for this project (not a lot!) and link to the D3 library at https://d3js.org/.
-
7
Read the Data
In this lesson, you'll learn how to use D3 to read CSV data from the data file. We'll step through how to process each line of data as it's read in from the file, and how to use the Promise object returned from the d3.csv method to work with the resulting data array in the code.
This is a long lesson but hang in there; at the end of the lesson you'll be reading data from the file and be ready to start working on turning the data into the visualization.
-
8
Process the Data
-
9
Do the Work: Practice Reading CSV Data
In a previous lesson you learned how we can read data from a CSV file using D3, creating an array of objects made out of each line of data in the CSV.
You also learned that D3 automatically uses the headings in the first row of the CSV file as the properties for each entry in the data (CSV is comma separated values, so each entry is separated by a comma on a line of data).
Write some D3 code to read in the attached file (Icecream.csv) and create an array of objects containing the ice cream data.
-
10
Work with SVG and D3
In this lesson you'll get an introduction to SVG and how to use D3 to generate SVG for a visualization. We'll write the code to generate the SVG element and add attributes to size it correctly for the visualization.
-
11
Method Chaining with D3
In this lesson, we'll talk about how you'll typically see D3 code written: using method chaining style. It's a good idea to get used to reading and using this style for programming D3. The D3 API was designed using the Fluent Interface Pattern which allows us to method chain most method calls in D3.
-
12
Bind Data and Elements
In this lesson, we'll create a SVG rectangle for each point in the data array. Each rectangle will be a color stripe in the final visualization. A key concept in D3 is data binding: that is binding data points in an array to elements you're creating and adding to a visualization. You'll learn how data binding in D3 works, and how to easily generate a SVG rectangle for each data point in our temperature anomaly data.
-
13
Do the Work: Add Attributes to the Stripes
We are creating a SVG rectangle for every point in our data array. Those rectangles are going to need to be positioned, and sized, and styled correctly so they look like the color stripes in the final visualization.
In this exercise, you'll try writing code to make each rectangle the correct size. By default each rectangle is 0 pixels in width and 0 pixels in height.
-
14
Add Attributes to the Stripes
It's time to size and position the rectangles we've created. In this lesson you'll learn how to use the D3 attr() method to set the width, height, and y position of the rectangles that we'll use to create the color stripes.
Don't forget that when we position elements in the browser, the top left corner of the browser is x, y position 0, 0. The x position increases as you move across the screen to the right, and the y position increases as you move down the screen from top to bottom. This is a little different from how you think about x, y axes normally (where y increases as you go up), so that's just something to keep in mind as you do this lesson.
-
15
Create a Function to Position the Stripes
If you want an attribute value of an SVG element to be based on information in the data point or its index in the data array, you need to get a handle to the data point somehow. In this lesson you'll learn how to do that with a function we pass to the attr() method. This is another key concept in D3 so spend time on this lesson and review it more than once if you need to!
-
16
Add some Color
We'll use an online color tool (colorbrewer2.org) to select colors for our visualization, and add these colors as an array of hex values. In this lesson you'll learn how to choose those colors, how to arrange them in an array, and learn the first steps of how to use the D3 style() method to set the "fill" property to assign a color to a data point.
-
17
Do the Work: Domain and Range
In D3, when we want to convert a value in one set of values (known as the domain) to another set of values (known as the range), we write a scale function. We'll get into a lot more detail about writing a scale function for our temperature anomalies in the next few lessons; in the meantime, practice by doing this exercise to convert dog ages into human years, and human ages into dog years. It's often said that a dog ages 5 years for every human year.
-
18
Convert a Temperature Anomaly to a Color
Converting data points to numbers representing colors or position or size is a common problem when visualizing data and it's one that D3 has methods to help with. In this lesson you'll learn about domain and range and how to think about converting one set of values to another. In our case, we want to convert temperature anomalies to color. In this lesson you'll think through how we can do that.
-
19
Create a Linear Scale Function
In this lesson, you'll create a linear scale function to convert a temperature anomaly (in the domain), to an index in the color array (in the range). You'll learn how to use the D3 scaleLinear() function and its methods domain() and range() to map from temperature anomalies to indices we can use in the color array to pick a color. This is another key concept in D3 so take your time, and make sure you understand each step.
-
20
Use the Scale to Style the Stripes
In this lesson we use the linear scale function we just created to style the stripes and complete the visualization. This is the last step! If all goes well you'll see the finished visualization once you complete this lesson, so hang in there, you're almost done.
-
21
Do the Work: Add Mouse Over Handling to Display the Year of a Stripe